We compared the results of our Support Vector Machine with a linear kernel to that of a Naïve Bayes learner. In addition, we considered the effects of vector normalization and word frequency versus word presence. Our results are shown graphically below.
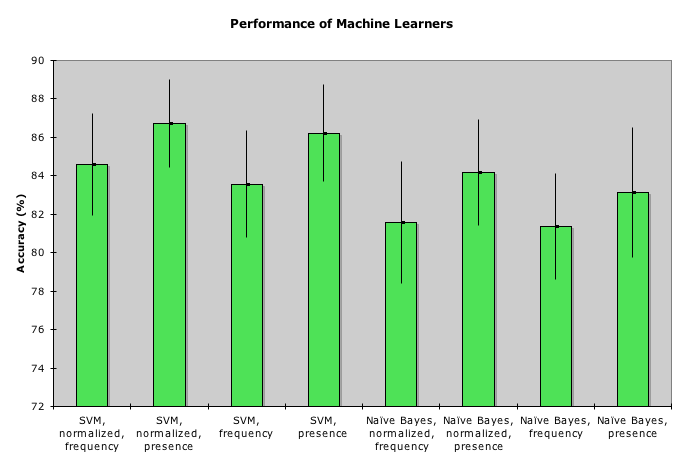
Our best results were obtained with the SVM and normalized presence data.
To obtain this graph, we performed a 10-fold cross validation three times (dividing the data three distinct ways) and averaged the results. The whiskers indicate one standard deviation above and below the result. A table with the details is provided below.
Accuracy is defined as number of correctly classified cases out of the total number of test cases. Or, in other terms:
(correctly_classified_positive + correctly_classified_negative)/(total_number_test_cases)
When normalization is applied, the vector of words is normalized to length one. This is supposed to correct for entries having different lengths.
When we consider frequency, the value of a given dimension is the number of times the corresponding word appears in the document. (This is before normalization is applied.)
When we consider presence, the value of a given dimension is 1 if the corresponding word appears in the document. (This is before normalization is applied.)
| (Seed 42) | SVM, normalized, frequency | SVM, normalized, presence | SVM, frequency | SVM, presence | Naïve Bayes, normalized, frequency | Naïve Bayes, normalized, presence | Naïve Bayes, frequency | Naïve Bayes, presence |
| Set 1 | 80 | 82.5 | 81 | 82.5 | 78.5 | 82.5 | 79 | 77 |
| 89.5 | 88.5 | 89.5 | 87 | 83 | 80.5 | 80 | 83.5 | |
| 83.5 | 89 | 86 | 90 | 80.5 | 84.5 | 77 | 86 | |
| 86 | 84 | 82.5 | 83.5 | 84.5 | 85.5 | 81.5 | 83.5 | |
| 84 | 84 | 82 | 84 | 80.5 | 81.5 | 80.5 | 77 | |
| 86.5 | 91 | 86 | 90 | 87 | 86.5 | 86 | 86.5 | |
| 85.5 | 88 | 82.5 | 86 | 76 | 82 | 77 | 80.5 | |
| 84.5 | 87.5 | 84 | 87 | 83 | 86 | 82 | 85 | |
| 87 | 86 | 84 | 85.5 | 85 | 87 | 85 | 86 | |
| 82 | 84.5 | 80 | 82.5 | 78 | 83 | 80 | 80.5 | |
| Set 2 | 84 | 86 | 82.5 | 87.5 | 83 | 84 | 83 | 85 |
| 85 | 86 | 78.5 | 86 | 82 | 87.5 | 84 | 83.5 | |
| 84 | 85.5 | 83 | 86.5 | 80 | 85 | 81.5 | 84 | |
| 87.5 | 89 | 87.5 | 89.5 | 85 | 86 | 84.5 | 85 | |
| 83.5 | 84 | 81.5 | 84 | 76 | 76.5 | 75 | 73.5 | |
| 80 | 84.5 | 81 | 82.5 | 80 | 84 | 80 | 85 | |
| 84 | 86.5 | 82 | 87 | 79 | 85.5 | 78 | 84 | |
| 86 | 89 | 86.5 | 88.5 | 83 | 85.5 | 83 | 85 | |
| 86.5 | 89 | 86.5 | 90 | 84 | 85.5 | 84 | 83 | |
| 86.5 | 88 | 86 | 87.5 | 85 | 87.5 | 84.5 | 87 | |
| Set 3 | 80.5 | 85.5 | 78.5 | 82.5 | 80.5 | 81 | 79.5 | 77.5 |
| 88 | 89 | 88.5 | 89.5 | 84.5 | 83 | 85 | 87 | |
| 81 | 81.5 | 81.5 | 82.5 | 73.5 | 78.5 | 77.5 | 79 | |
| 85.5 | 88.5 | 84 | 87.5 | 82 | 85.5 | 82 | 82.5 | |
| 85.5 | 88 | 83 | 87.5 | 86 | 87 | 84 | 85.5 | |
| 80 | 84.5 | 82 | 82.5 | 81 | 83.5 | 80.5 | 82.5 | |
| 89.5 | 88.5 | 85.5 | 87.5 | 84.5 | 88.5 | 82.5 | 85 | |
| 83 | 87.5 | 81.5 | 85 | 80.5 | 82.5 | 80.5 | 82.5 | |
| 86 | 88.5 | 86.5 | 88 | 82 | 86.5 | 80.5 | 85 | |
| 82.5 | 87.5 | 83 | 87 | 80 | 83 | 83 | 86.5 | |
| mean | 84.57 | 86.72 | 83.55 | 86.22 | 81.58 | 84.17 | 81.35 | 83.12 |
| stddev | 2.65 | 2.28 | 2.78 | 2.53 | 3.18 | 2.76 | 2.76 | 3.39 |